BeMED 19. Gathering data to measure the extent of beach litter on a beach – Biology/Science Fieldwork
Title |
Gathering data to measure the extent of beach litter on a beach – Biology/Science Fieldwork |
Author |
Cynthia Caruana |
Age Guide |
Year 8–11 |
Subject Area |
Integrated Science, Biology, Education for Sustainable Development |
| Preparation Time | 30 minutes |
| Estimated Duration | 120 minutes on site
60 minutes follow-up for learners (in case of report or publication) |
| Site | Rocky/ Sandy beach of your own choice
All learning resources are being provided for: Golden Bay Sandy Beach, Għajn Tuffieħa in Malta Resources can be adapted for other beaches. |
| Educational objectives | – Learners will investigate the litter that may be found at the beach, including its origin and possible method of dispersal as well as identify whether litter is biodegradable and non-biodegradable.
– Learners will assist in a clean-up and learn to dispose of the litter found on the beach in their appropriate waste bag. – Learners will use simple calculations to find the area studied and the percentage frequency of the litter found as well as weighing mass of micro-plastics and waste found. – Learners will use observation skills, estimation, data collection and skills of analysis together with teamwork. |
| Learning Outcomes | – I can describe what is littering the beach and investigate the frequency of the most common litter items.
– I understand the relationship between humans and marine organisms. – I can critically assess and give a rating to the quality of a beach in terms of its litter. – I recognize the importance of taking action to reduce the impact of the beach litter problem. |
| Link to SDGs | SDG 12: Responsible Production and Consumption
SDG 14: Life below Water SDG 15: Life on Land |
| Educational resources required | Appendix 19.1 – Background information
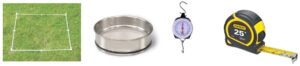
Appendix 19.2 – Consent form Appendix 19.3 – Map of area under study (Golden bay, Malta) Appendix 19.4 – Traced map Appendix 19.5 – Weather forecast Appendix 19.6 – Worksheet 1 Appendix 19.7 – Adapted worksheet Appendix 19.8 – Different origins of litter Learners will bring their own: · Tablet/writing materials · Photo camera/mobile · Gloves · Small jar for collecting micro-plastics · Spade and bucket Equipment needed for each working group: · Frame Quadrat · Sieve · Waste bags for collection: grey bag for plastics, black bag for general waste, white/organic waste bag and reusable container such as bucket for glass · Weighing scales (1 to share between groups) · Tape measure (1 to share between groups)
|
| Remote preparation (if applicable) | · 1 week before activity day, learners’ parents/guardians need to sign consent form to allow them to participate in activity (Appendix 19.2)
· 1 day before activity day, learners will need to download or print (depending if tablet will be used) a map of the area (Appendix 19.3), the area is to be traced on a sheet of tracing paper (Appendix 19.4) · Weather Forecast for activity day (Appendix 19.5) · Download or print-outs of worksheet for data collection (Appendix 19.6 or 19.7) · Proper attire for lesson including boots and waterproof jacket |
| Planning Considerations | Weather: if inclement weather is forecasted, the day of the activity might need to be changed in order to gain maximum benefit.
Gloves are to be used when collecting litter. In the case of syringes, used contraceptives and disposable face masks, these are not to be touched. Assistance of teacher/facilitator may be requested if in doubt. Depending on the number of learners, each class can be divided into teams of a maximum of 4 learners per team. For each team, a set of equipment as explained above needs to be provided. |
| Method | Introduction
From a top position above site (example before going down steps at Għajn Tuffieħa Bay: 1. Take note of the general state of the beach as regards litter. 2. Mark any clumps of litter on the traced map (Appendix 19.4) 3. Discuss within the group what types of beach litter will be found. 4. Estimate your initial beach litter state. (Very poor, poor, fair, good, very good) Development Closer inspection of the area: The area under study is divided into sub-areas (as shown on the map in Appendix 19.4) and the learners are divided in groups of 3 or 4 learners. 1. Each group will take 10 random quadrat samplings in their designated area. For each quadrat there will be consideration of the (i) above sand litter (any litter on top of the sand) as well as (ii) below sand litter (in the case of a sandy beach there may be litter below the sand as well, example micro-plastics.) 2. List the different items of litter visible on the sand. Use Worksheet (Appendix 19.6 or 19.7) for data collection purposes. A photo of the quadrat may be taken. 3. Discuss the frequency of each item and count the number of each item within the quadrat area. 4. Discuss the possible source of origin of the litter (Refer to Appendix 19.8 for guidelines) and the possible dispersal method (example: washed ashore or dispersed from land). 5. Discuss whether the item is biodegradable or not and which waste bag can be used for proper disposal of the waste. 6. Once these items have been separated in their proper stream, with the use of a spade, bucket and sieve, 10 cm of top sand are sifted and the micro-plastics as well as any other litter is collected and also analysed following the steps above. Micro-plastics may be collected in a jar. 7. Estimate of area of beach being investigated, using the map and/or tape measure. Calculate the area covered by the quadrat frame. 8. Calculation of percentage frequency of different types of litter: (can be worked out at school) % frequency = number of quadrats in which the litter is found total number of quadrats 9. Comparison of results with all different groups in the different areas under investigation. Each working group can weigh the different streams of wastes and sum up the final amount. Conclusion – Which litter item/s has the highest frequency? – How does your group’s findings compare with that of different learners in different sites in the sandy beach area? – Which area contains the highest amount of litter? (Close to the water or further away) – What is the amount of litter that was cleaned up from the beach? – Has your final rating for the beach under study changed from your initial estimate? (Very poor, poor, fair, good, very good) Give a reason for your answer. |
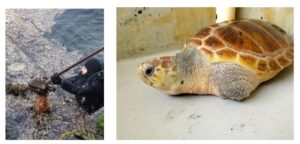
| Follow-up | What could be the possible impact/s of the litter on land/marine biota (organisms)? Example Loggerhead turtle entangled in fishing nets and other marine debris. This may cause ingestion, infection and possibly loss of flippers and death.
Sea turtle entangled in ropes Loggerhead turtle with amputated flippers Observe any signs of colonization on the waste found. This can give an indication of how long the litter has been present and may throw light on possible mutualistic relationships that may occur. |
| Background information for educators | Refer to Appendix 19.1. |
| Adaptations | An adapted worksheet (Appendix 19.7) may be used for data collection. |
| Extensions | Write an article with the findings from the investigation which would bring attention to the litter problem and involve communities to be proactive about it.
How does the findings on this beach compare to other European beaches? (Refer to: https://mcc.jrc.ec.europa.eu/documents/Marine_Litter/MarineLitterTOPitems_final_24.1.2017.pdf Devise criteria for a beach’s rating based on your findings from this fieldwork. Example: very poor rating – a beach who contains more than 80% cigarette butts, more than 30g micro-plastics within area of investigation; and so on for each rating of poor, fair, good and very good. Area calculations can also be used. This rating may then be used with studies of different beaches. |
Malta Web Designer & Web Developer Elaine Vella Catalano - © EkoSkola Malta